
Actual Interactive Map Can Be Accessed HERE.
For over 150 years, countless maps have omitted the presence of slavery in Indian Territory and never have maps been shown to reflect the geographic distribution of slaves within the Five Civilized Tribes. Those tribes specifically are the Cherokee, Choctaw, Chickasaw, Creek, and Seminole Nations. Because slavery is not widely studied west of Arkansas, maps have never reflected this history.
Until now.
Background
When I see historic maps that reflect slavery in North America, I cannot help but stare at the blank spake right above Texas when I see those maps. But, having ancestors who come from what is now Oklahoma, and knowing that they were enslaved in Indian Territory, I stare at that space, because I know that there were people enslaved in that place, and among them were my own ancestors living in the Choctaw Nation. However, in most texts, the maps always reflect the lands just north of Texas as being a land where slavery was not present. I cannot help but see those historical maps and stare that the big hole in the middle. The "big hole" is the space right above Texas.

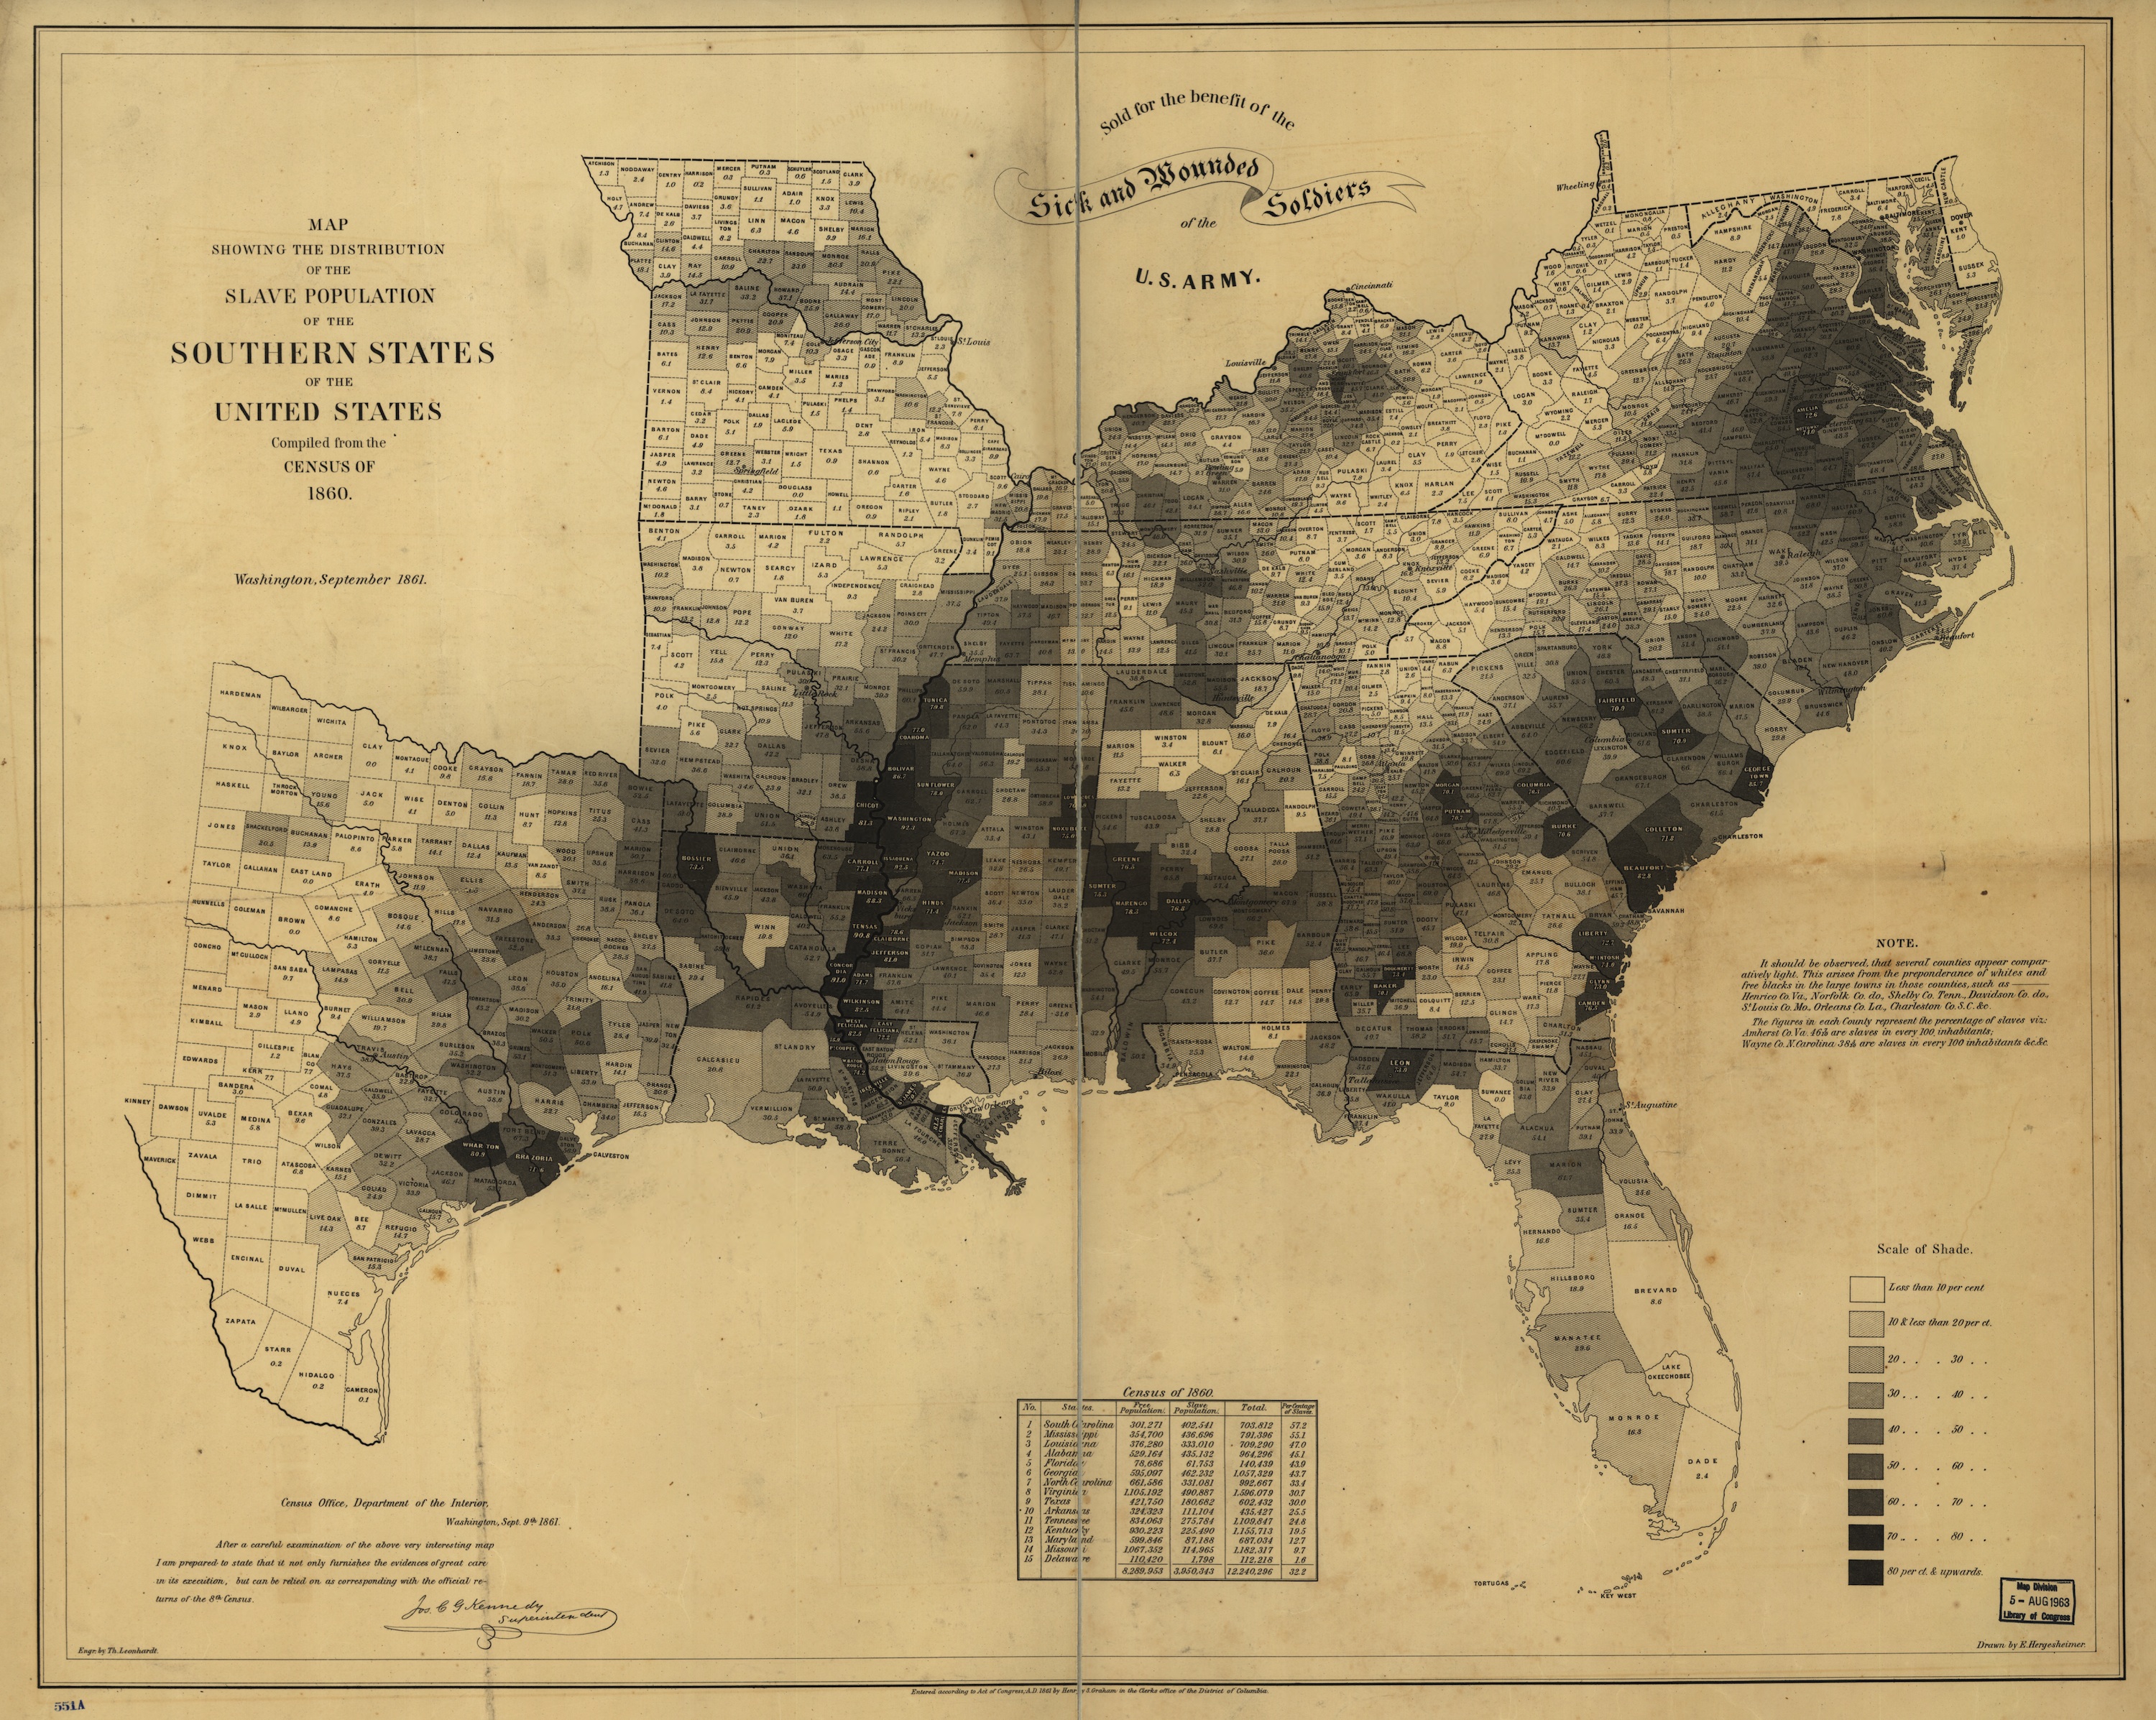
Map Showing the Distribution of the Slave Population
of the Southern States of the United States Compiled from the Census of 1860
Washington September, 1861
Map accessed from Mapping the Nation
The map above is the "MASTER" of slavery maps. It was created in 1861 by the US Coastal Survey and was compiled from census data. It is also the map that was presented to President Lincoln to illustrated the prevalence of slavery in the southern states. (A zoom-able version of this map can be found HERE.)
There are other maps such as the one below that fall into the category of "historical geography" that were used to share a policy and where the effects of that policy prevailed. But again, in that map one sees Arkansas, then a vertical line skirting around Indian Territory (now Oklahoma) and into Texas. The map was used to show the "curse of slavery". But the "curse" did extend west, directly into Indian Territory.

Accessed from Mapping the Nation
Map by John F. Smith, in the Library of Congress "Historical Geography" Map, 1888
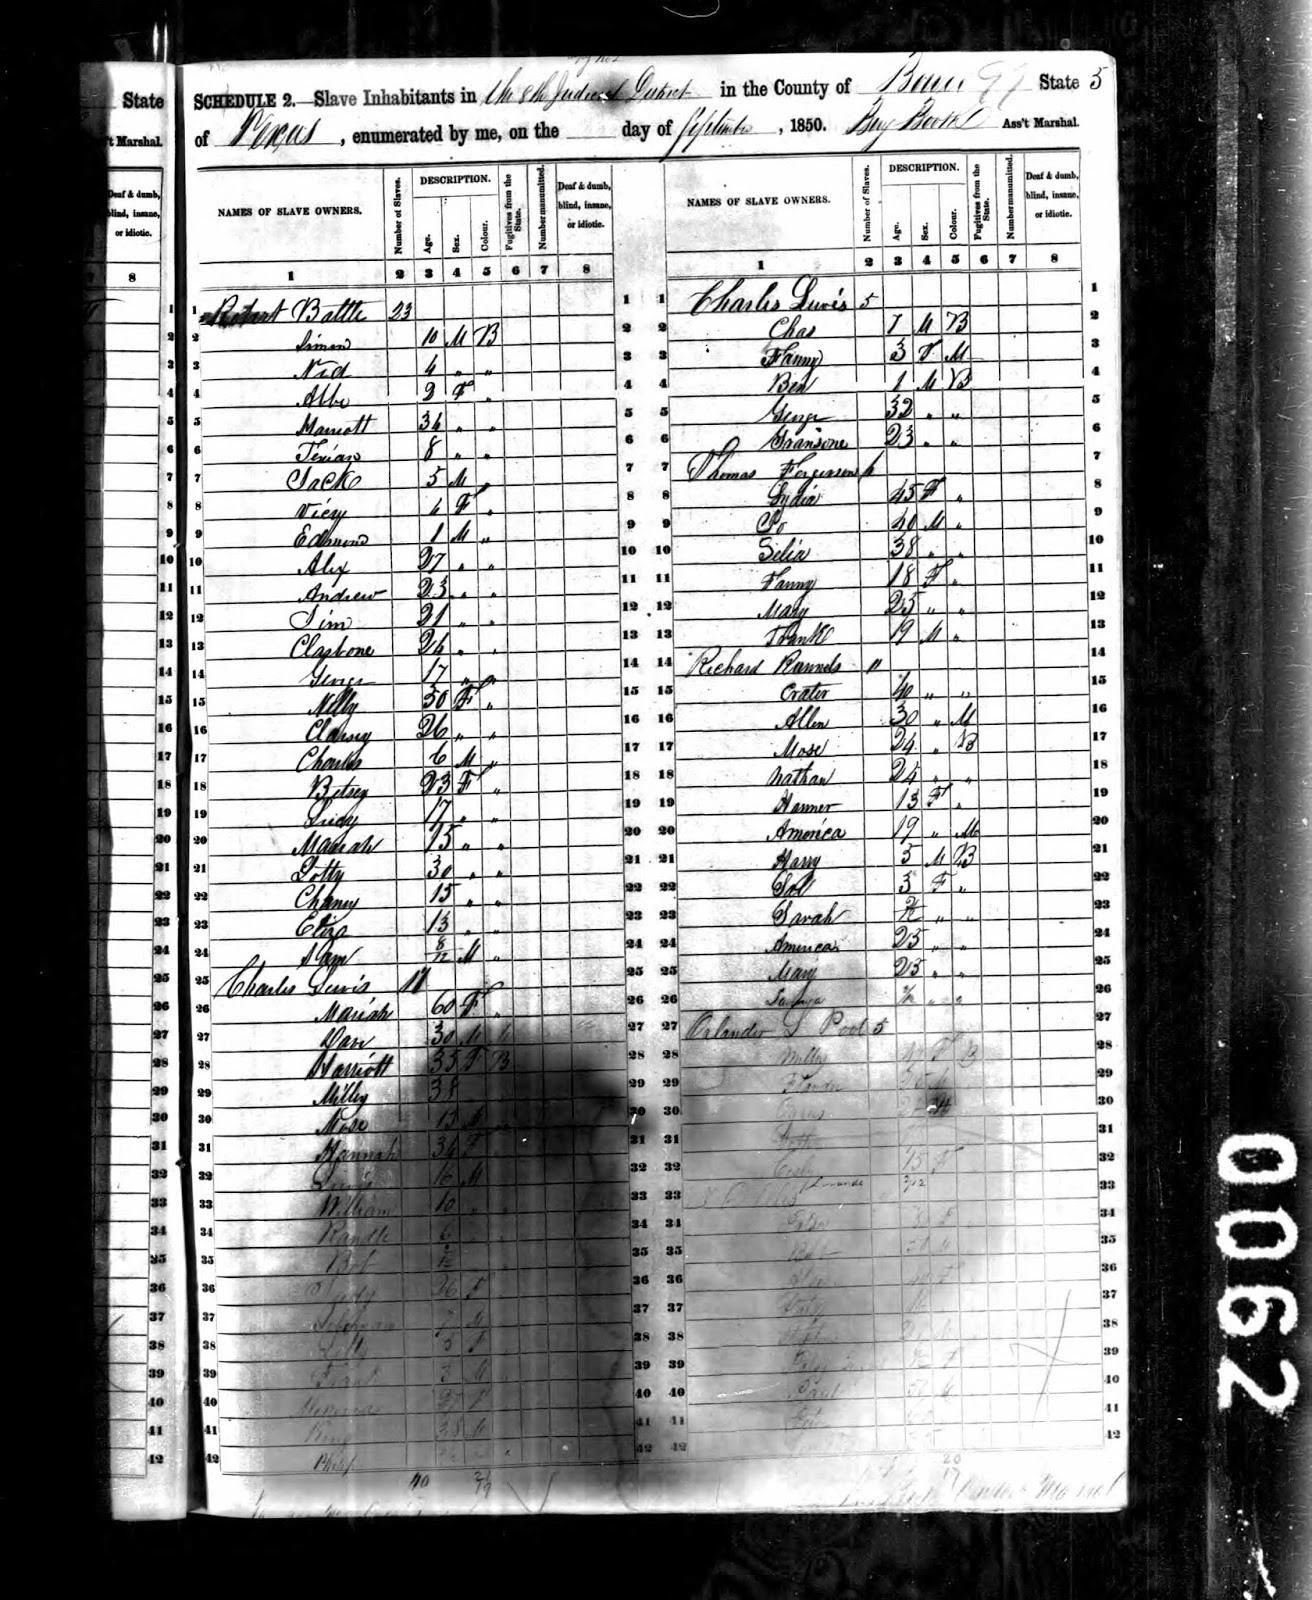
The Arkansas Slave schedule is found on National Archive microfilm population M653 Roll 54. All of the Arkansas counties are listed on the reel of microfilm. Following Yell county, the list of enslaved people in Indian Territory begins.
There are 865 images on that reel of microfilm. On that record, there were slave holders such as Cherokee Chief John Ross, or Choctaw leader Robert Jones who owned hundreds of Black people as slaves.

Yet countless maps omit the presence of slavery in Indian Territory and never have maps been shown reflecting the geographic distribution of slaves within the Five Civilized Tribes. Those tribes specifically are the Cherokee, Choctaw, Chickasaw, Creek, and Seminole Nations. Maps have never reflected this in textbooks. Until now.
For the most part, it is not generally taught that slavery even occurred in Indian Territory. That oversight has made the omission of slavery in the Territory easy to overlook in the American historical narrative. However, slavery did occur in the territory, and it was real, it was painful, and there were runaways, slave uprisings, and efforts among the enslaved to become free from bondage. Therefore, the more I studied maps and records, the more I saw a need to see a map reflecting the land of my own ancestors--the enslaved people of Indian Territory.
Finally thanks to the technology of Google Maps, and using the 1860 slave schedule, a new map reflecting slavery in Indian Territory has been made.
The New Map This new map has made a part of the interactive map on the website, "Mapping the Freedmen's Bureau." By using Google maps, the markers are placed to coincide with the communities that were clearly defined in the 1860 slave schedule. The markers are also placed accurately with the appropriate geographic coordinates. By using Google Maps the markers reflect the actual community where the enslaved families were held. In the years after freedom, many people remained in the same communities especially during the first years of freedom, so this map also represents these families in both slavery and freedom. And there was an extremely large contraband camp at Fort Gibson, and that encampment site is also marked on the map.
Some Indian tribal Freedmen were even captured in the collection of records from the Freedmen's Bureau. Many lived close to the Arkansas border and used the services of the Bureau in nearby Arkansas. The Fort Smith Bureau reflected Cherokee citizens appealing to the Freedmen's Bureau for help.
Contents of the map
For this map, the Cherokee, Choctaw, and Chickasaw nations are more thoroughly reflected. That is because there was a more thorough assessment of the slave holders of the nation. In the Creek Nation, the slave holders and their slaves were recorded, but the different tribal towns were not indicated on the slave schedule, as the slave schedule would simple describe the residence as "Creek Nation, West of Arkansas." As a result a single marker was placed marking Okmulgee the capital of the Creek Nation. Similarly, for the Seminole nation. Seminole leaders such as John Jumper, Billy Bowlegs and others were also slave holders, but the enumerator did not go into Seminole country, and thus a single marker is placed over Wewoka, the capital of the Seminole Nation. When and should a better site with a link appear, additional markers will be added for those two communities.
When Using the Map
The map provides a direct link to the Internet Archive where one will find the 1860 slave schedule reflecting the people enslaved in Indian Territory communities. (This includes a direct link to the Creek Nation pages as well.) By hovering the mouse or cursor over a marker, a small pop-up window will appear, and that window will contain a link to the exact pages on the Internet Archive that contain the images of the slave schedule reflecting Indian Territory. By clicking on that pop up, the user will find the direct link in the text about the site description.
About the Slave Record
It is noted that the 1860 slave schedule contains the name of the slave holder and the number, gender, and complexion of the enslaved population kept in bondage. The slave schedule can be used in a community study, or an analysis of the age, gender breakdown, and status-whether runaway or still physically held. Though names of the enslaved were not recorded, the record still provides useful data, when compiling the family narrative particularly whether they were part of a large estate, or a small family held by one person.
In the Cherokee Nation the districts represented are:
Canadian
Delaware
Flint
Going Snake
Illinois
Cooweescoowee (Kooweeskoowee)
Saline
Sequoyah
Talequah
In the Choctaw Nation, the districts represented are:
Atoka
Blue
Botuklo
Cedar
Cole
Eagle
Gains
Kiamitia
Red River
Skullyville
Sugar Loaf
Towson
In the Chickasaw Nation, the districts represented are:
Panola
Pickens
Pontotoc
Tishomingo
In the Creek Nation, the area represented is:
Okmulgee
In the Seminole Nation, the area represented is:
Wewoka
This is the first time that slavery has been "mapped" for Indian Territory, and hopefully in the future, a more thorough representation of the heartbreaking institution of slavery will be shown. Thanks to Google maps, this story can now more accurately be told, and reflected.


